Results
Tropospheric Ozone Climatology
A differential absorption lidar (DIAL) for tropospheric ozone profile measurements has been operational since November 1999. This system has measured ozone profiles with 75 m fundamental resolution and from ~4 to 20 km altitude on more than 500 nights during the period 1999-2002. The use of an additional channel from the stratospheric system allows extending the upper limit of the profile to altitudes near 28 km. The vertical and seasonal structure of the nighttime ozone number density is shown here.
A clear annual cycle peaking above 50% at altitudes around 15 km is characterized by a maximum in late winter/spring and a minimum in late summer/fall. A secondary maximum is observed in early winter. The annual cycle in the upper troposphere reverses around 23 km to display a typical maximum during summer in the mid-stratosphere, as already observed by our co-located stratospheric ozone lidar.
The springtime maximum between 15 and 20 km is associated with enhanced ozone in the frequent polar vortex filaments passing over TMF when the spring vortex is either disturbed, or breaks down. The springtime maximum between 10 and 15 km, is also connected to meridional circulation, as the mid- and high latitude tropopause surface is displaced southward of the TMF location, leaving layers of enhanced ozone aloft. A weak signature of stratospheric intrusion is also observed in the mid-troposphere in late spring.

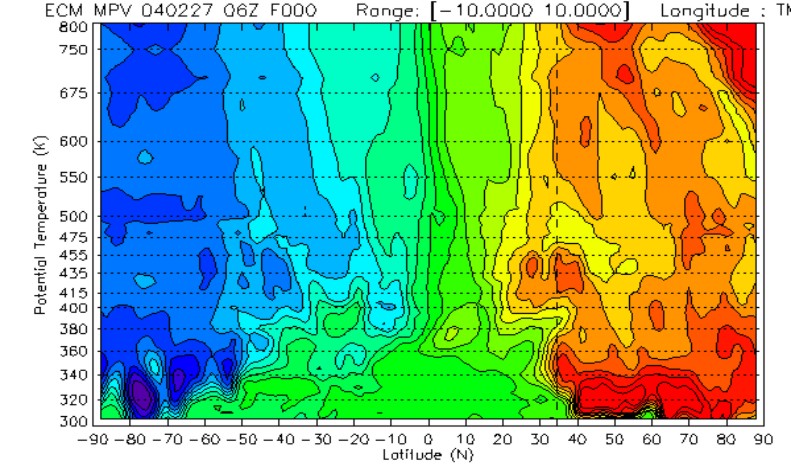

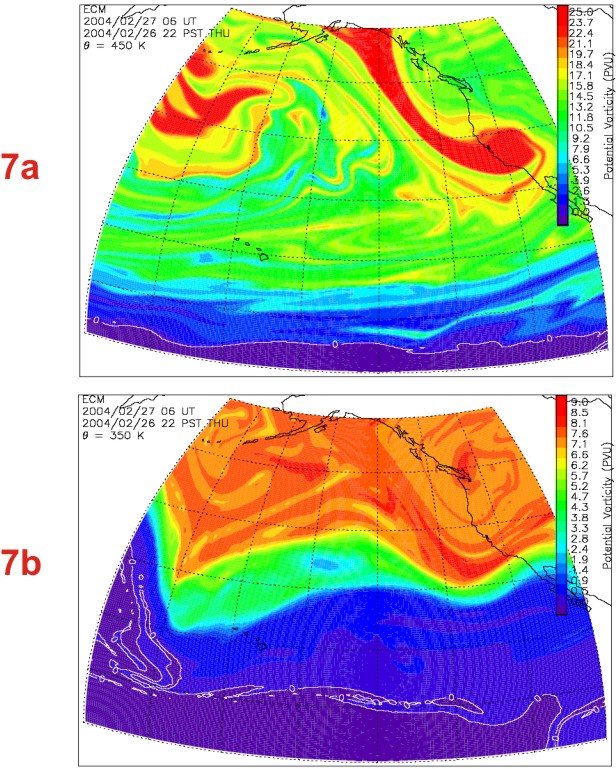 Figure 1 (TMO, below-left) and Figure 2 (TMF, below-right):
The annual cycle is clearly characterized by a persistent ozone minimum near 15 km altitude. However strong internannual variability can be observed. Day-to-day inspection of the ozone profiles also show a large day-to-day variability.
Figure 3 (TMO, above-left) and Figure 4 (TMF, above-right):
The 5-year climatology shows a very well pronounced annual cycle around 15 km characterized by a maximum in late winter/spring, and a minimum in late summer/fall. The peak-to-peak variation exceeds 100%, which is not surprising considering the small amounts of ozone at this altitude. A secondary maximum is observed in December around 17-22 km, but the present statistics are not robust enough yet to clearly identify its origin. Another ozone maximum is observed in late spring around and below 10 km. This is likely a consequence of the occasional stratospheric intrusions observed during this season. Despite the fair data time-overlap between the stratospheric ozone measurements (no measurements in 2000) and the tropospheric ozone measurements, there is an impressive agreement between the climatologies obtained from each lidar. In particular, the “double minimum” in summer and fall around 15 km is remarkably well captured by both lidars.
The example of 27 February 2004 was chosen for its outstanding double-layer features. Each layer of enhanced ozone is representative of a well identified feature throughout the 4½ years of measurements. To illustrate the major role of meridional transport, the latitudinal cross-section of Modified Ertel's PV (Lait PV, [Lait, 1991]) is plotted in Figure 5, and the PV maps at 2 isentropic surfaces 350 K and 450 K are plotted in Figure 7 a and b.
Figure 5 (PV cross-section below left), Figure 6 (ozone profile below right):
In figure 5, two layers of higher MPV can be observed to extend south of 35ºN. One layer represents the southern extension of the tropopause surface (near 350-360 K and 35 km). The other layer represents the southward extension of the polar vortex filament around 435-450 K. These two layers are associated to the layers of enhanced ozone observed by lidar at 18-19 km and 13 km (figure 6). Between the two layers of enhanced MPV, low values of MPV typical of the tropical upper tropospheric reservoir extend north of 35ºN. This corresponds to the layer of poor ozone observed around 15-16 km by lidar.
Figure 7a-b (isentropic PV maps below):
As can be seen in Figure 7a, the upper layer is associated with a polar filament passing over TMF. Filaments like this one are observed either when the vortex is strongly disturbed by planetary waves, or after the vortex breaks down and subsequently “dilutes” at mid and lower latitudes.
The lower layer of enhanced MPV/ozone is associated with the southward displacement of the tropopause surface intersecting the 350 K surface. For reference, the commonly used “2 PVU” dynamical tropopause is located well south of TMF, insuring the lidar site to be located in the bulk of the mid-latitude lower stratosphere (rich in ozone).
References
McDermid, I. S., G. Beyerle, D. A. Haner, and T. Leblanc, Redesign and improved performance of the JPL-TMF tropospheric ozone lidar, Appl. Opt., In press, December 2002.